Showing posts with label Event review. Show all posts

Friday, December 17, 2021

The Making of a Historic Wind and Fire Event

The recent historic wind and fire event that literally blew through the Great Plains was anomalous in every sense of the word. But, not all anomalies are created equal. We see high-impact events all the time, but not all fall into the historic category. With today’s post I wanted to dig into some of the science behind this event and what set it apart from other high-end events.

Let’s first set the stage. A potent shortwave ejected out of the Central Rockies Wednesday morning, December 15, 2021, and very rapidly lifted northeast from the Central Plains into the Upper Midwest/Great Lakes by Wednesday night. Negatively-tilted shortwaves often mean business, and this one was no different.

What set this system apart from similarly-tilted shortwaves was the very strong mid-level jet that accompanied it. The observed 12z sounding at ABQ showed a 500mb wind speed of 100kt, while the observed 12z DDC sounding measured a 700mb wind of 65 kt. 


The 21z RAP 500mb analysis (shown earlier) suggested a peak mid-level wind speed of around 120 kt at 500mb as it moved out over Kansas. A mid-level jet that strong this time of year is more unusual.

Let me pause here a minute. Take a close look at that DDC sounding again. 


 On a day like this, with deep mixing expected, you can sometimes use an observed morning sounding to get a rough idea of how strong the winds might be in that area later in the day. In this case, the morning started with a fairly stout inversion across western and central Kansas, but the forecasted combination of daytime heating with cooling aloft (beneath the shortwave) suggested the potential to mix deeply, with the sounding revealing how strong the winds may be within that mixed layer. The DDC sounding, for example, showed 60-80kt in the potential mixed layer, suggesting peak wind potential of 80-90 mph for any area that could mix deep enough. The 21z RAP analysis reveals the areas from western to central Kansas where some of the deepest mixing occurred (shown by the steepest low-level lapse rates).

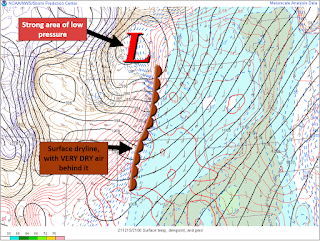
At the surface, an unusually deep surface low developed, adding a strong pressure gradient component to the wind potential. In Minnesota, the low pressure set arecord. The strong downslope drying east of the Rockies also helped setup a sharp dryline across Nebraska and Kansas.


The ECMWF’s Extreme Forecast Index (EFI) really helps put it all together. The EFI is a great forecasting tool to help determine which events may be anomalous. It can also reveal the anomalous events that are not like the others. 

On the map above, you’ll notice the EFI is maxed out (pink shading) over a large area of the Plains. Looking closer, though, you’ll notice a Shift of Tails (SoT) of 2. In my experience, that’s a separating marker between events. For wind, the combination of a high EFI value AND a SoT of 2 puts an area in a higher-end, potentially record-breaking, setup. The end result? A widespread area of verystrong, damaging winds. The wind, alone, was anomalous, but this event didn’t stop there.

When you overlap strong winds with a warm and very dry airmass, bad things tend to happen. This event appeared to be a classic fire outbreak setup, as researched and shown by Lindley,et al.


Adding fuel to the fire, literally, was very dry antecedent conditions. From an anomaly standpoint, there was a very large footprint of dry conditions across Kansas, with much of the state running 10-25%, or less, of normal for rainfall (since November 1, 2021). Fire weather aside, this also added to the risk of blowing dust.


Higher end fire weather days do occur on the Plains, but another aspect of this event that sets it apart is that it came in December. This December has been an active one for fire weather in Kansas. In fact, since 2006, only one other December was more active (2017). Outside of 2017, no other December in that time period even comes close.


Lastly, I want to highlight the anomalous combination of shear and instability, by December’s standards. The focus for severe weather was over the Upper Midwest, but it all started in the Central Plains. A plume of high PWats surged north through the Central Plains, ahead of the ejecting shortwave, and went well north all the way into, and through, the Great Lakes region. Getting that amount of moisture return that far north in December is a low frequency occurrence, and more unusual in December.


A moistening airmass beneath steep lapse rates and cooling temps aloft supported modest destabilization, and a weakening cap, ahead of the advancing dryline/Pacific cold front. This was accompanied by more than adequate shear for organized severe convection.


The shear/instability combo isn’t unusual for this part of the U.S., in general. In December, though? Not so much. An anomalous combination of shear and instability stretched from Kansas to Michigan, setting the stage for a remarkable swath of severe weather, including several tornadoes. And notice, once again, a Shift of Tails of 2 on the EFI plots below.

For perspective, Kansas, Nebraska, Iowa, and Minnesota have had more Severe Thunderstorm Warnings issued this December than any other December on record (dating back to at least 1986, based on IEM data). Since this post was focused on the science and anomalies of the event, though, I’ll leave the product climatology for another day. 

In summary, a truly historic, mid-latitude storm system had a “perfect storm” combination of high-end anomalies from top to bottom, and everywhere in between. Anomalous features regularly come around, but not all at the same time. Every now and then, though, they line up in perfect sync, often with devastating impacts. This post only touches the surface of the science involved in this event, but I hope it provided a little context to just how anomalous and unusual this event was over a huge footprint of the U.S., while also serving as a mini training moment for what to look out for in future higher-end wind and fire events. 

NOTE: Some of the mesoanalysis images shown above were from the NWS Wichita’s event summary. I helped make that summary, and the images I used in this blog are ones I made. I just wanted to clarify that in full disclosure to make sure it is understood that those images were not improperly taken from someone else's work.

Sunday, May 3, 2020

May 3, 2020 MCS Review

May 3, 2020 MCS Review (central/eastern KS)

As a general rule, convection is a tough, and humbling, phenomena to forecast. But, elevated convection? Well, that's a level above (pun intended). I don't always have time to review every event I work, but I try to when possible. The note with any review I do is it's simply a way to think back through an event and see what I can learn. If others have insights, I'm all ears. Let's learn together.

Before going any further, let me tell you what I didn't do well. I forecast quarter size hail and no wind of any significance. Our CWA ended up with 2" hail and 70-80 mph wind gusts. This is why I do reviews of events (in case you were wondering).

Early in the morning, thunderstorms developed over central Kansas and quickly became severe. Those storms eventually congealed, forming the beginning stages of a long-track MCS (as shown by Sean Ash) that produced severe weather well into the TN Valley.


Days in advance, this event carried a lot of uncertainty with it. Zonal flow with embedded shortwaves; questions about moisture depth/quality (especially following a more amplified upper level pattern that sent drier air well into the northern Gulf of Mexico); and less-than-stellar model agreement.

From a forecast standpoint, the part that gave me some pause (for initiation, coverage, and severity in KS) was questions surrounding moisture return and what impact the warm temps at the base of the EML plume would have on capping. 23 hours out, the RAP was forecasting some decent moistening around 850 mb, but even that wasn't enough to fully erode the elevated cap in place (we've had some very steep lapse rates recently, by the way).

23 hr RAP Forecast Sounding near Wichita, KS (valid 08z May 3)
23 hr RAP Forecast Environmental Parameters near Wichita, KS (valid 08z May 3)

MUCINH was around -40 j/kg, so not insurmountable, especially with an embedded wave forecast to move through and convergence along a west-east baroclinic zone, but not a guarantee of development either.

23 hr RAP 700 mb Temperature Forecast (valid 08z May 3)
Jumping ahead in time closer to initiation, the 2 hr RAP forecast sounding for Wichita showed a bit more moistening in and around 850 mb, but potentially more importantly, it also showed slightly cooler 700 mb temps, effectively removing any inhibition.

2 hr RAP Forecast Sounding near Wichita, KS (valid 08z May 3)
2 hr RAP Forecast Environmental Parameters near Wichita, KS (valid 08z May 3)

Weaker inhibition, modest large-scale forcing for ascent from the shortwave, and a mid-level convergence zone, and I'm assuming that is what gave rise to the fairly rapid development in/around the greater Wichita metro. As far as why storms formed where they did, it appears initiation held off until the shortwave/mid-level convergence zone interacted with instability axis oriented SW to NE across southern KS.

2 hr RAP Forecast Instability and 0-6 km shear (valid 08z May 3)
Sometimes it seems like elevated convection is more sensitive to subtle features (moistening, temperatures aloft, etc). Maybe that's the case with all convection, but it certainly seems important in this one. One of the forecasters at my office (WFO ICT) keyed in on one potential subtlety.  When he came on shift, he noticed a more backed flow in the low-levels on the ICT VWP compared to what models were forecasting the night before. That piqued my interest, and was something I didn't even think of looking at. It appears it was an important find.

The 23 hr RAP forecast sounding (valid near initiation time) showed westerly winds around 5 kt at 850 mb, while the 2 hr forecast sounding (valid near initiation time) showed slightly stronger 850 mb winds (15 kt) that were slightly south of due west. In fact, the 2 hr RAP forecast showed slightly better veering in the 850-700 mb layer. The end result was effective SRH of 96 m2/s2 (23 hr forecast) vs 144 m2/s2 (2 hr forecast). Both soundings had similar shear and instability, but that added SRH might have contributed to several of the updrafts being more efficient at acquiring low-mid level rotation.

It appears the increased potential for rotating updrafts aided in some larger hail sizes being realized and might have contributed to downdrafts being able to reach the ground more efficiently than would otherwise have been expected with a more stable SFC/near-SFC layer. That second possibility is pure speculation.

On the topic, though, I was very surprised to get a 76 mph wind gust so early in the event. It pays to look at more than just one forecast sounding prior to an event. Lesson learned! Take a look at the RAP forecast sounding for southeast Kansas (where the strongest wind gusts in our CWA occurred).

4 hr RAP Forecast Sounding over SE KS (valid 10z May 3)
4 hr RAP Forecast Environmental Parameters over SE KS (valid 10z May 3)

Despite southeast KS being post-frontal, it appears the drier low-level air, that was observed further west near Wichita, was not fully realized to the east. So, perhaps the better low-level moisture further east of I-35 allowed storms to be rooted a bit closer to the SFC compared to further west? If so, this might also explain the noticeable increase in SFC wind gust speeds as storms progressed further east.

Thoughts? Observations? Let me know!

Credits

Forecast soundings and analysis maps courtesy College of DuPage.
Storm reports courtesy SPC.